D A T A S C A P E
by Yitian Wang, Yi Liu, and Matty A. Williams
Synthetic Urban Ecologies Studio, 2013
We propose a framework that will bring forward hidden information in order to create a virtual landscape. In order to unveil ‘hidden’ data, in real-time, we are creating a tool for use by various parties interested in environmental justice for West Oakland, CA. Community members are physically impacted by poor air quality, but have no way of understanding the real-time data, in its current, to a degree that enhances the ability to sense their environment.
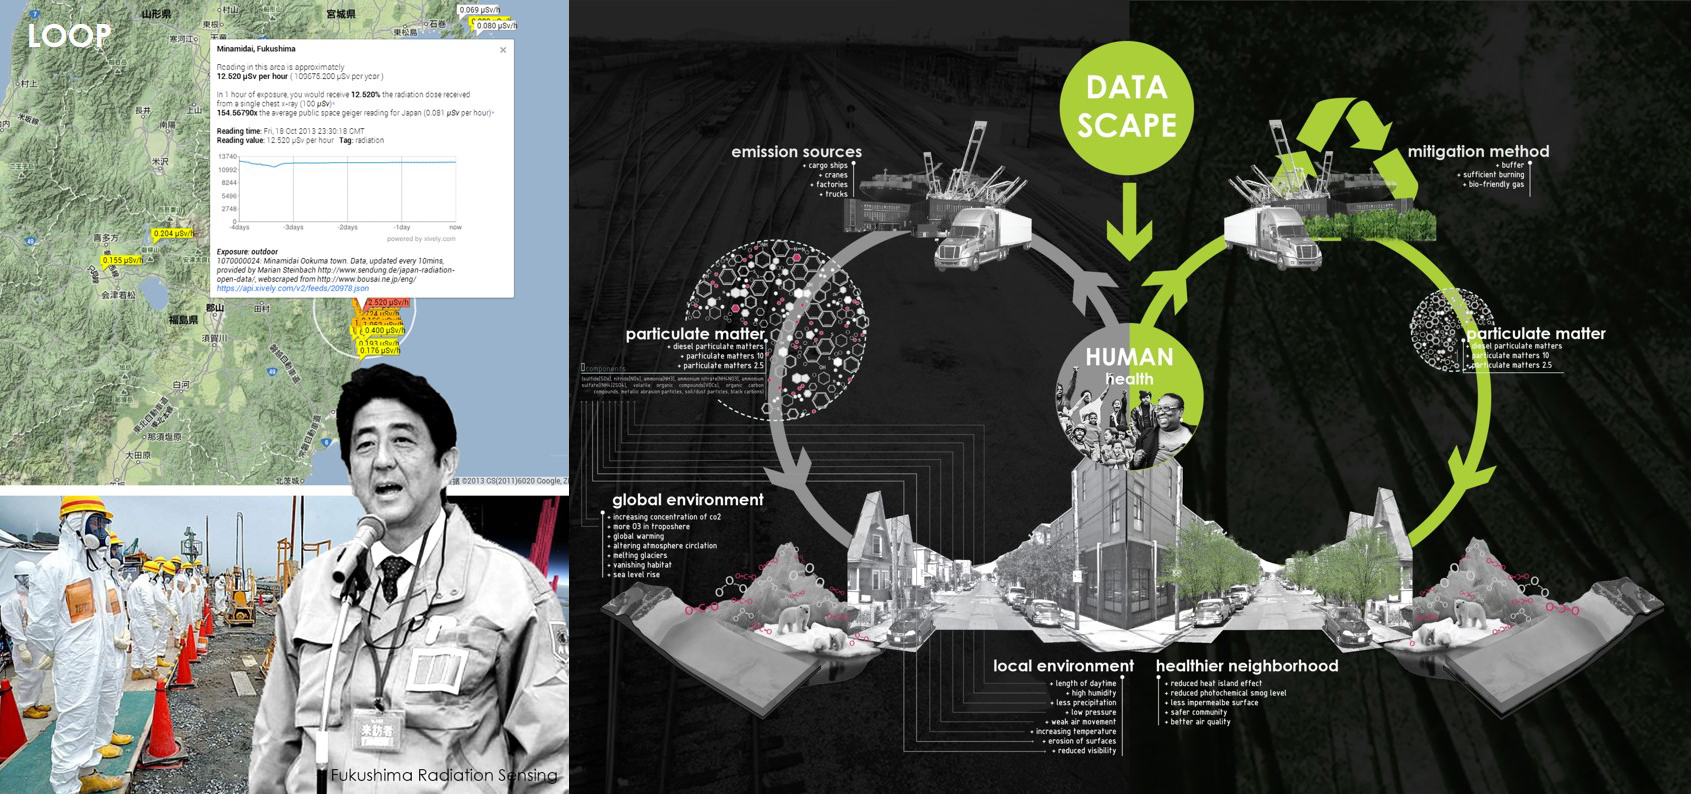 Interstate traffic, factories near residential neighborhoods, and the nearby port industry emit large amounts of pollutants, which spread into West Oakland. Particulate matter makes up the largest concentration of emissions. Our research identified two issues regarding the measurement of pollution throughout West Oakland: 1) current data recording methods do not allow for data interaction at the local (community) scale and 2) there is an issue in citizen’s ability to comprehend and react to environmental stressors. Overall, access to clear data communicating the quality of the air at any given site throughout West Oakland is needed.
The impact of democratizing data became evident after the March 11, 2011 tsunami devastated Japan and caused a nuclear accident. A sensor device designed by Libelium was dispersed to help people in Japan measure levels of radiation in their everyday life after the Fukushima disaster. Radiation levels measured by citizens locally, when compared to the Japanese government’s stated radiation levels, produced overwhelming discrepancies. As a result, the Japanese government accelerated nuclear cleaning efforts. Taking cues from Fukushima’s radiation sensors, we have an opportunity to improve environmental quality and human health in West Oakland, CA. We propose a framework which allows the West Oakland community to understand ambient environmental conditions, in real-time, and thereby make healthier commuting decisions.
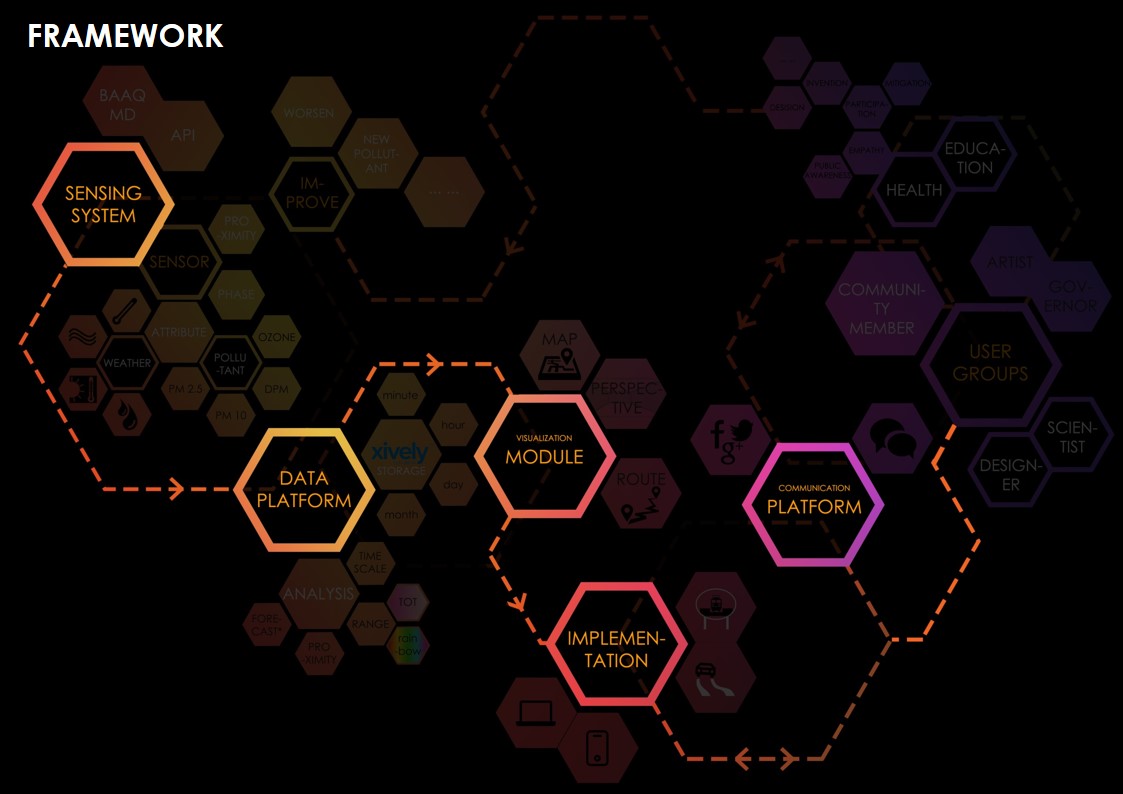 The framework contains five major components including a Sensing System, Data Platform, Communication Platform, Data Visualizations, and Infrastructural Implementation.
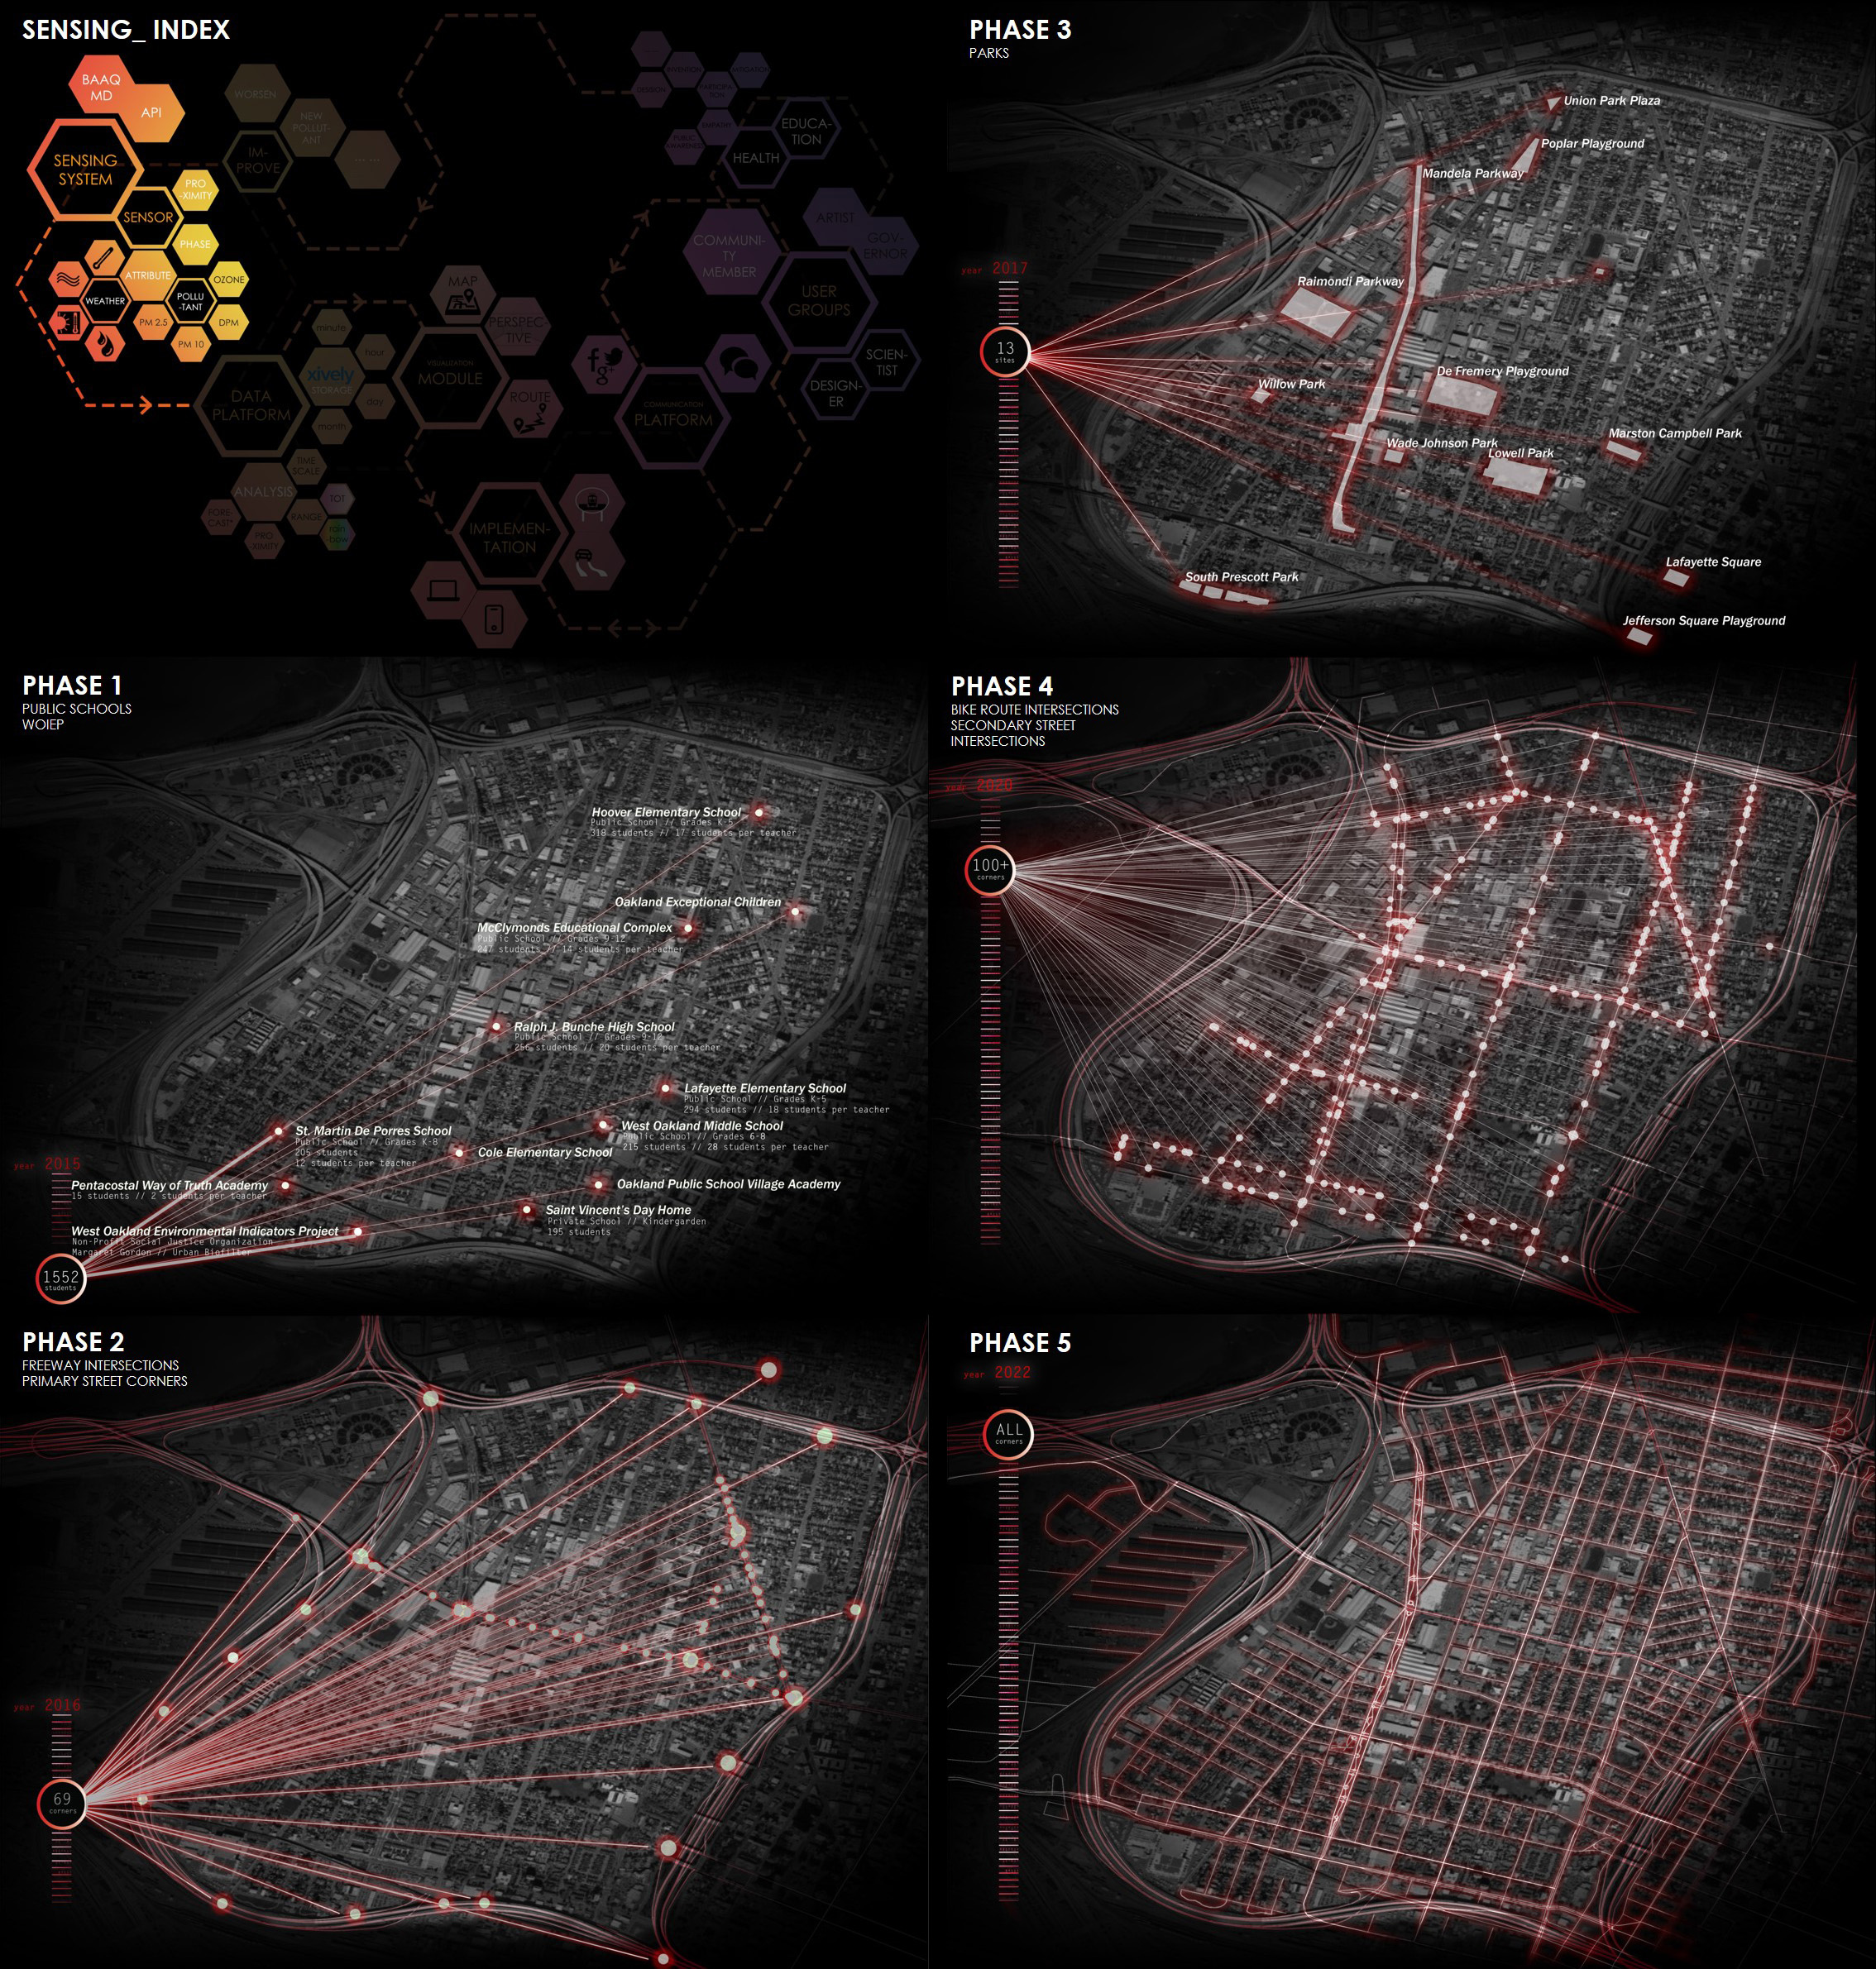 This system archives environmental data from the Bay Area Air Quality Management District (BAAQMD) and air sensors dispersed throughout West Oakland. Sensors enable pollution concentrations (PM2.5, PM10, DPM, and Ozone) to be recorded in real-time, with geo-tagged coordinates. Weather attributes including temperature, humidity, wind, and photochemical smog. Each sensor has proximity of 250 feet.
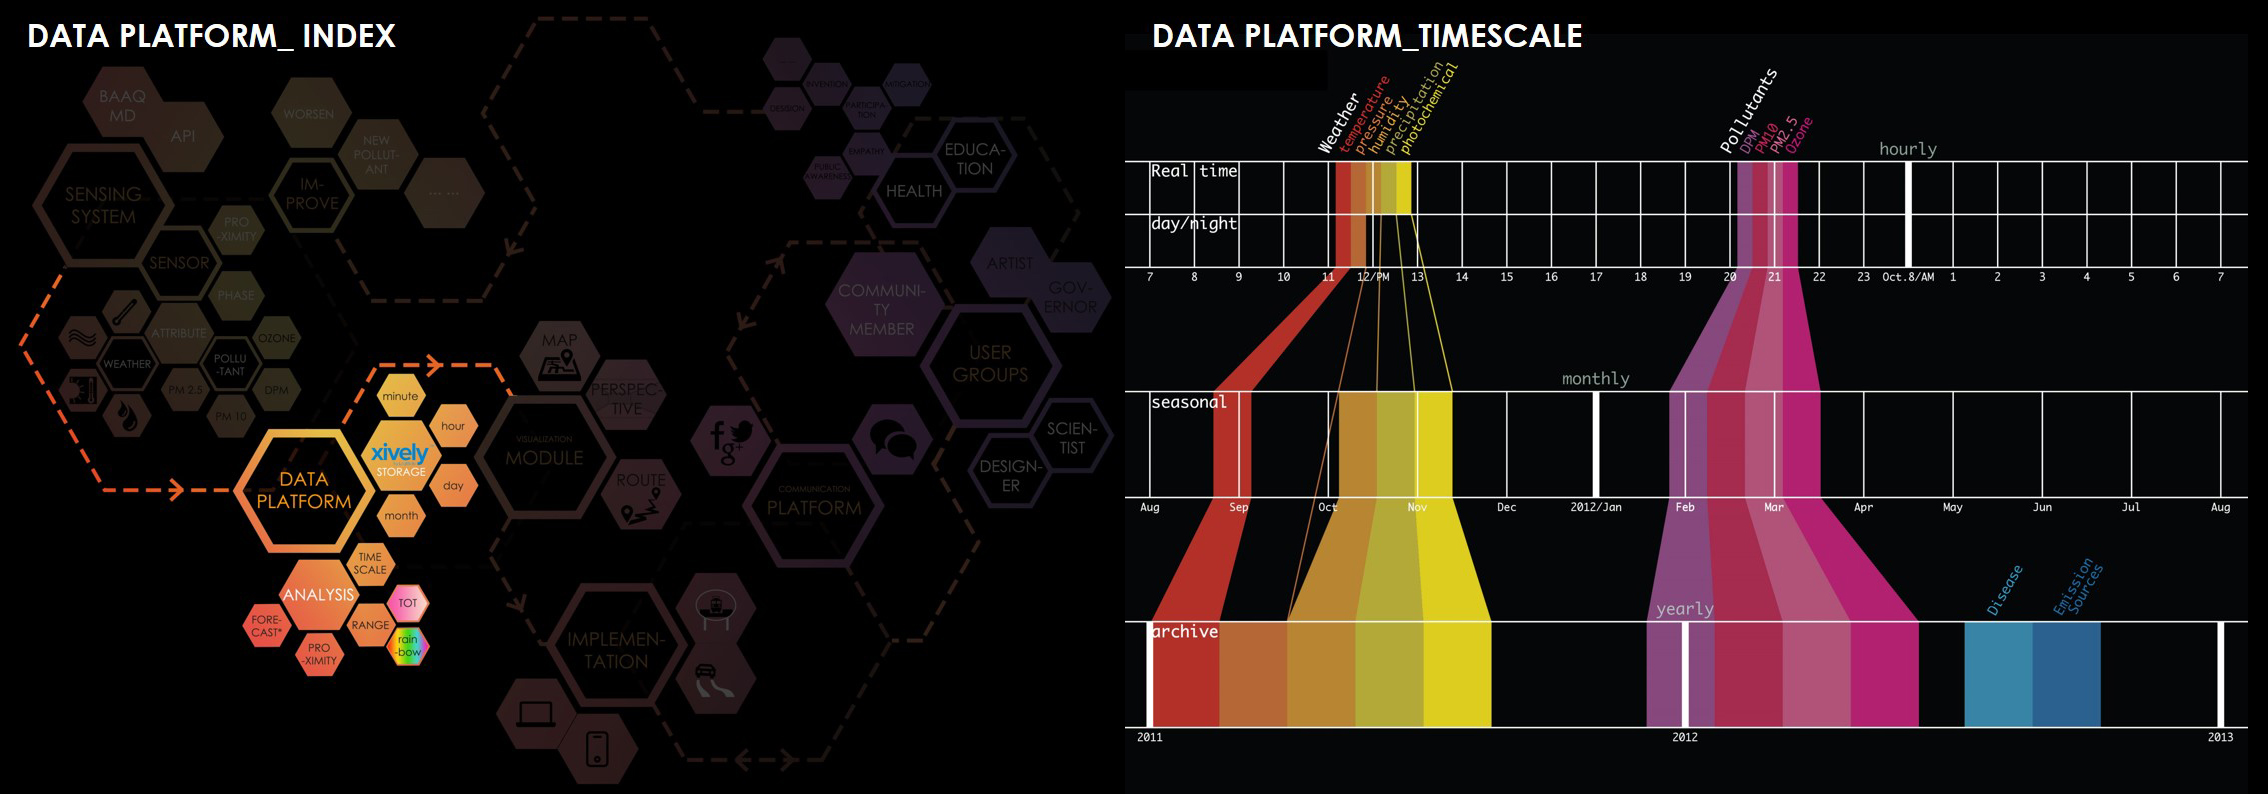 The data platform provides the definition of visualization and implementation. Xively, a customizable data hosting site, allows us to crowd-source data from our sensing system and compile this data at different time scales. The visualization of this data temporally allows for easier comparison, and a better understanding of fluctuating air quality.
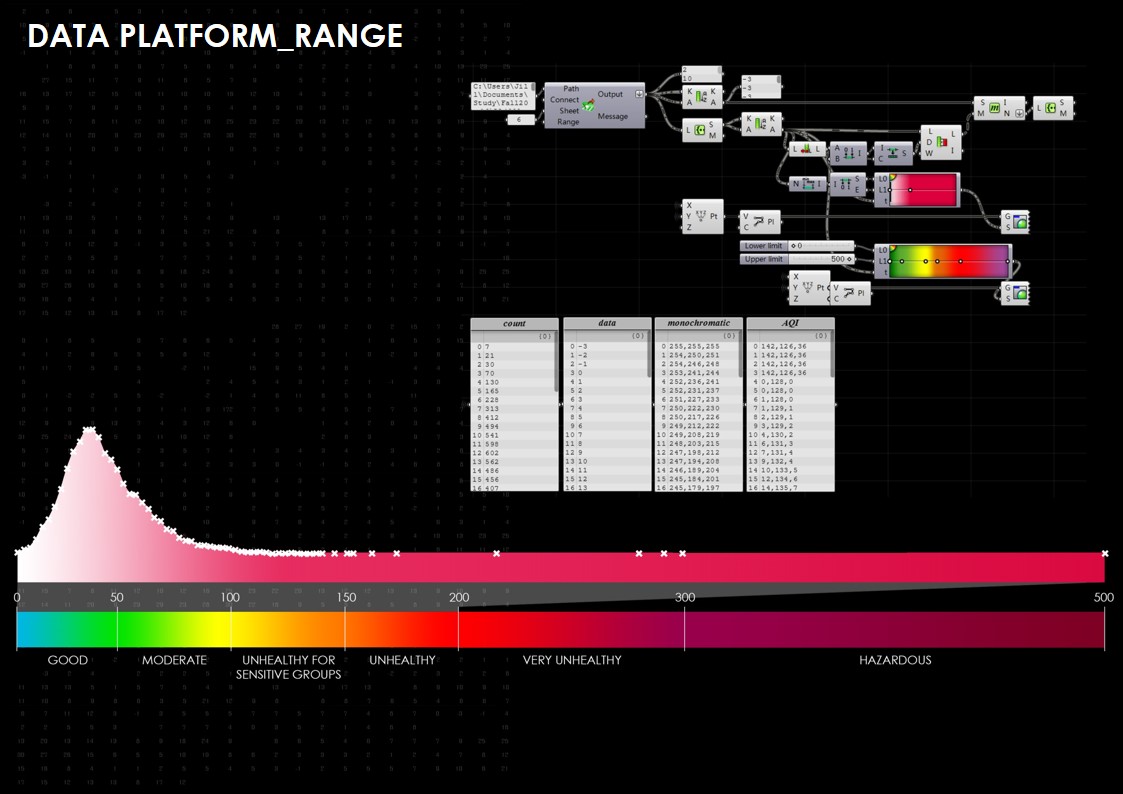 Within this platform, we have created an Air Quality Index (AQI) color range and a monochromatic color range. Utilizing Grasshopper parametric modeling to determine the monochromatic range, we created a relationship between X (real time data) and Y (time interval) coordinates based on the data provided by one central monitoring tower within West Oakland. In addition, we developed a bar graph of the AQI set by EPA, which indicates PM levels and their associated health risk.
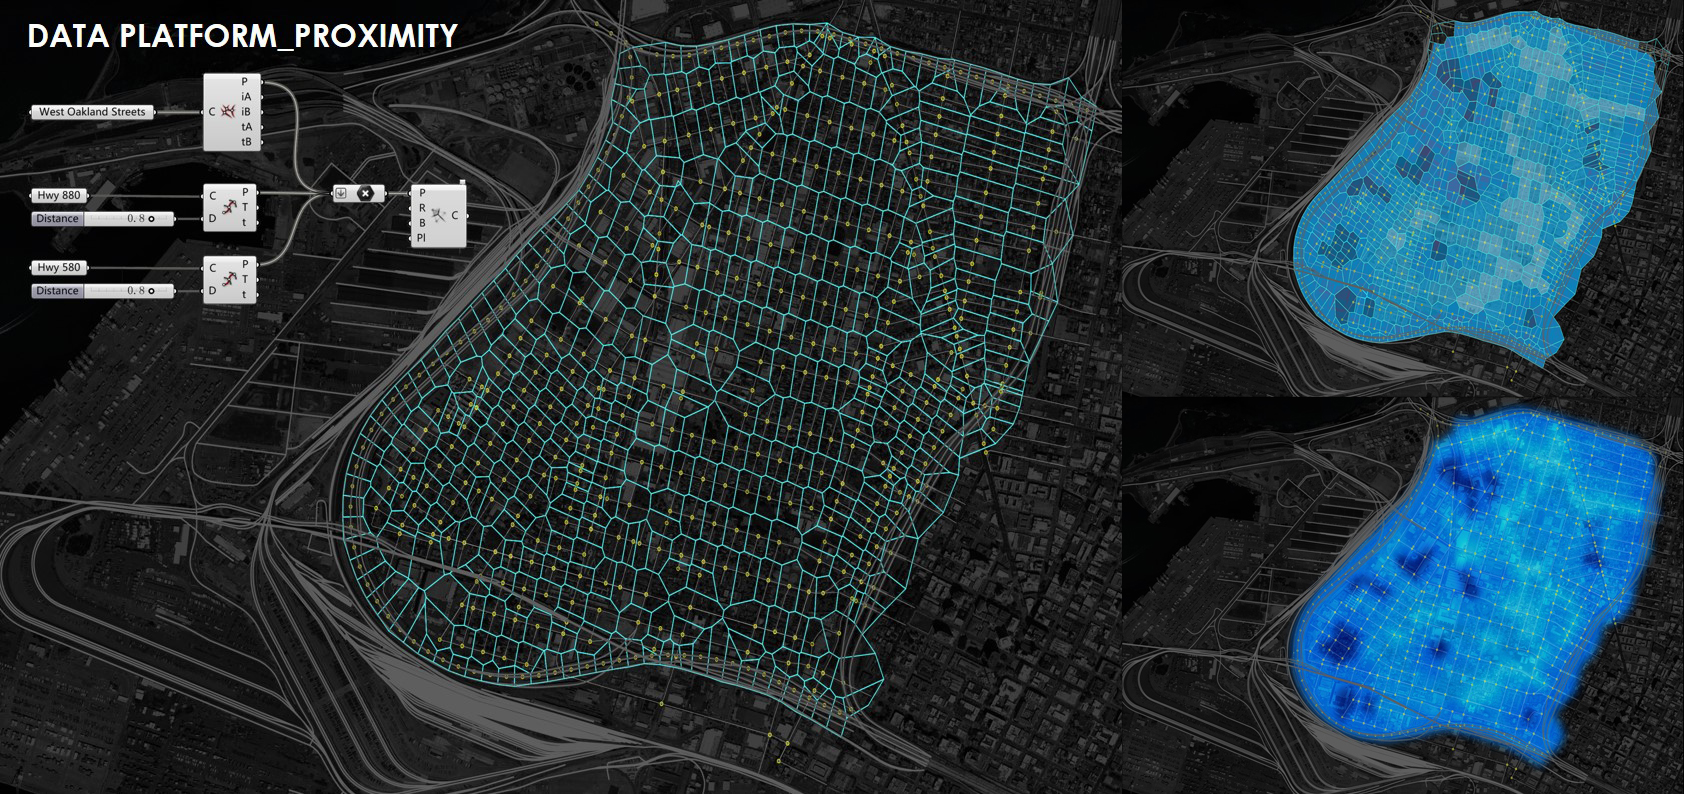 A voronoi definition in grasshopper defines the proximity of the colors converted from our monochromatic range. The mid-perpendicular of each line of connecting sensors intersects and forms cells of colors, which read as a heat map of environmental quality when blurred.
 Through three user interfaces and one plug-in for the Google Map API, this portion of our framework includes the communication platform and real-time visualization modules.

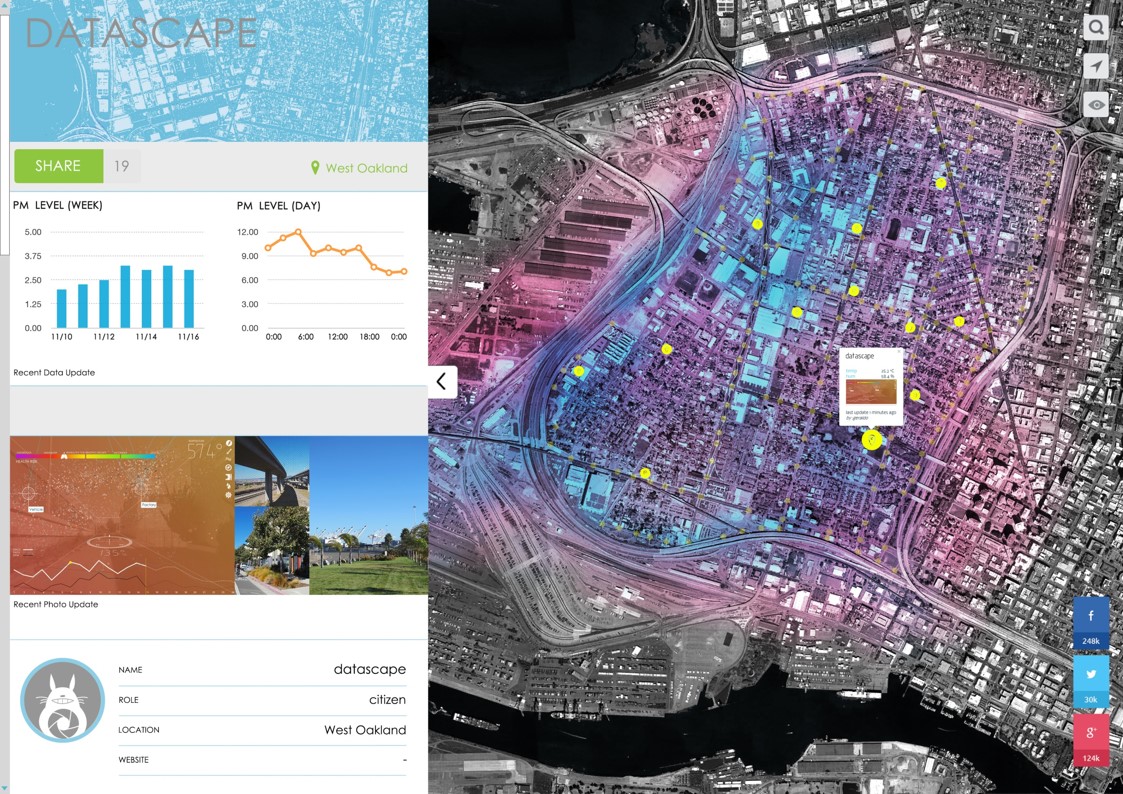
The map interface provides an overview of PM levels in West Oakland. The chart at the bottom shows pollution data at different timescales overlaid in a perspective interface. Interactive icons enable easy toggle between an individual sensor’s readings, identification of nearby emission sources, and health risk levels within the given proximity. The exported interface is shown in the example as a composite map displaying temperature, PM levels, health risk, direction, and emission sources simultaneously.

The second interface utilizes perspectives to illustrate PM levels and the associated health risk when people hold their phones out to scan the environment. The intensity of the color gradient overlaid on the interface, along with the health bar slider atop the interface, communicate the perceived health risk at that locale. Animated particle densities indicate fluctuating PM levels. The interface highlights emission sources, while other basic components such as a compass and weather attributes further help people internalize their surroundings. Over time, users will begin to read their environment based on these color and visual cues to air quality.

The third component to our visualization module is a route-choosing plug-in for Google Maps, utilizing gHowl, the Google Map API, and our proposed sensing system. We created a geo grid based on street intersections in West Oakland, and used our data platform to evaluate PM level at each intersection. The Google Map API proposes routes to users in a direction search. Simultaneously, the grasshopper model selects the closest coordinates and evaluates the maximum/minimum/average/mean levels of PM along each route. A recommendation of which route to take is now considers routes with lower exposure to PM concentrations. Ideally the route choosing protocol should encourage healthier decision making abilities on behalf of West Oakland residents.
The communication interface gives a private web forum for sensor users and West Oakland residents at large. In addition to providing a virtual space for interaction, and collecting information from social media site postings and hashtags to determine the ‘virtual’ mood with respect to air quality.
 The implementation of our strategy encompasses a website, mobile app, site installation, and public infrastructure. The product of this framework, we hope, will result in real-time data accessible by designers, scientists, community members, artists, and policy makers.
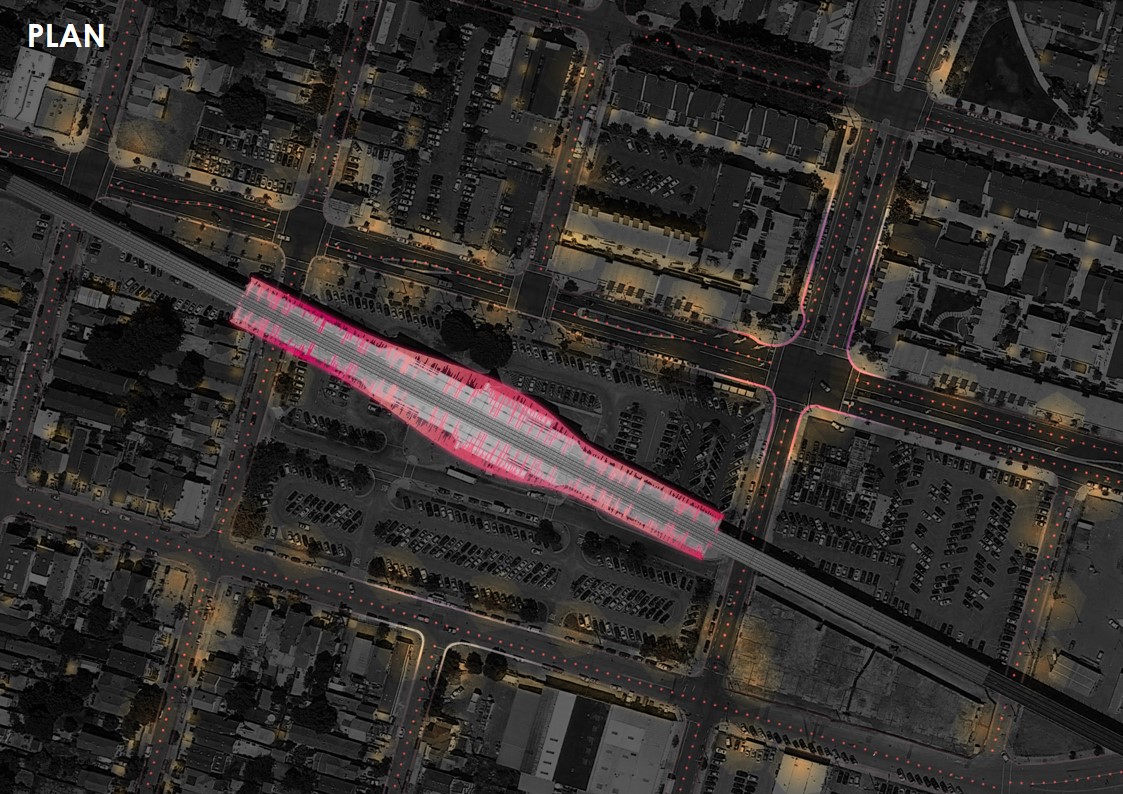 The plan shows the installation and infrastructure we propose; a new armature for the BART Station and a new lighting system for the streets of West Oakland.

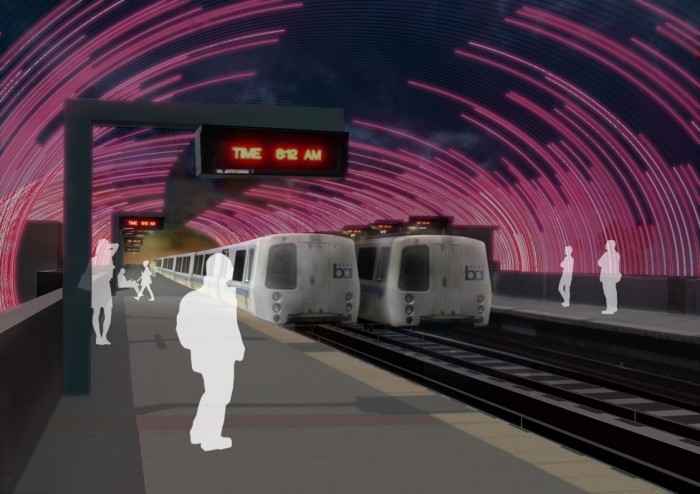
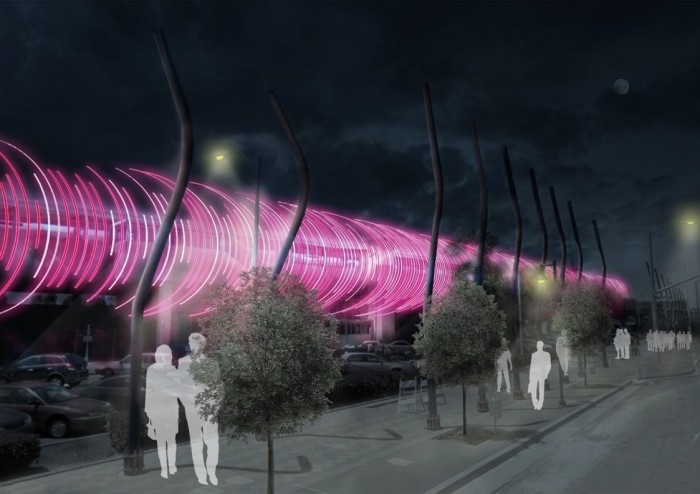
The new BART armature uses strips of LED lights to illustrate regional and local PM levels at different time scales. The BART station forms a confluence of different user experiences, specifically with relation to passage time through, or by the station. User experience with this site can range from minutes to an entire day. As such, we wanted to make the armature respond to this time sensitivity. Each individual strip is used to represent a one minute change of both regional and local data. Local PM levels are translated as a certain color intensity within a monochromatic gradient. The length of each strip is determined by the regional PM level, every minute. Each minute throughout the day a new PM level reading is disseminated from the center line of the station.
The animation illustrates the changing of the new BART armature over a 24-hour time period. People can see ‘growing’ strips originating in the center of the station and radiating to either side, every minute thereafter.
Click here for an interactive tour of our installation proposal.
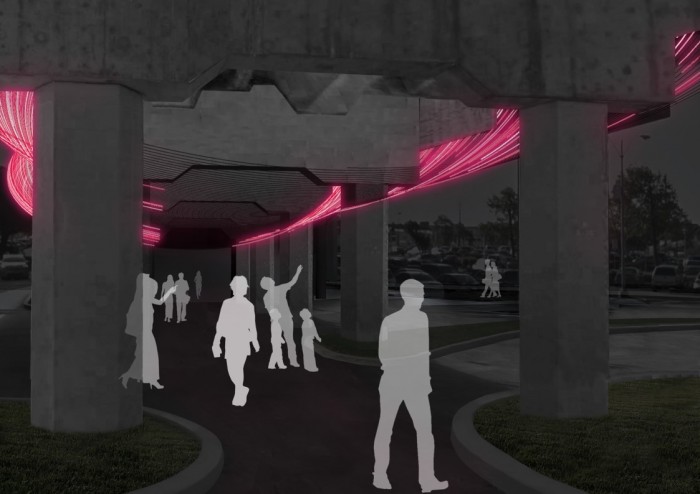
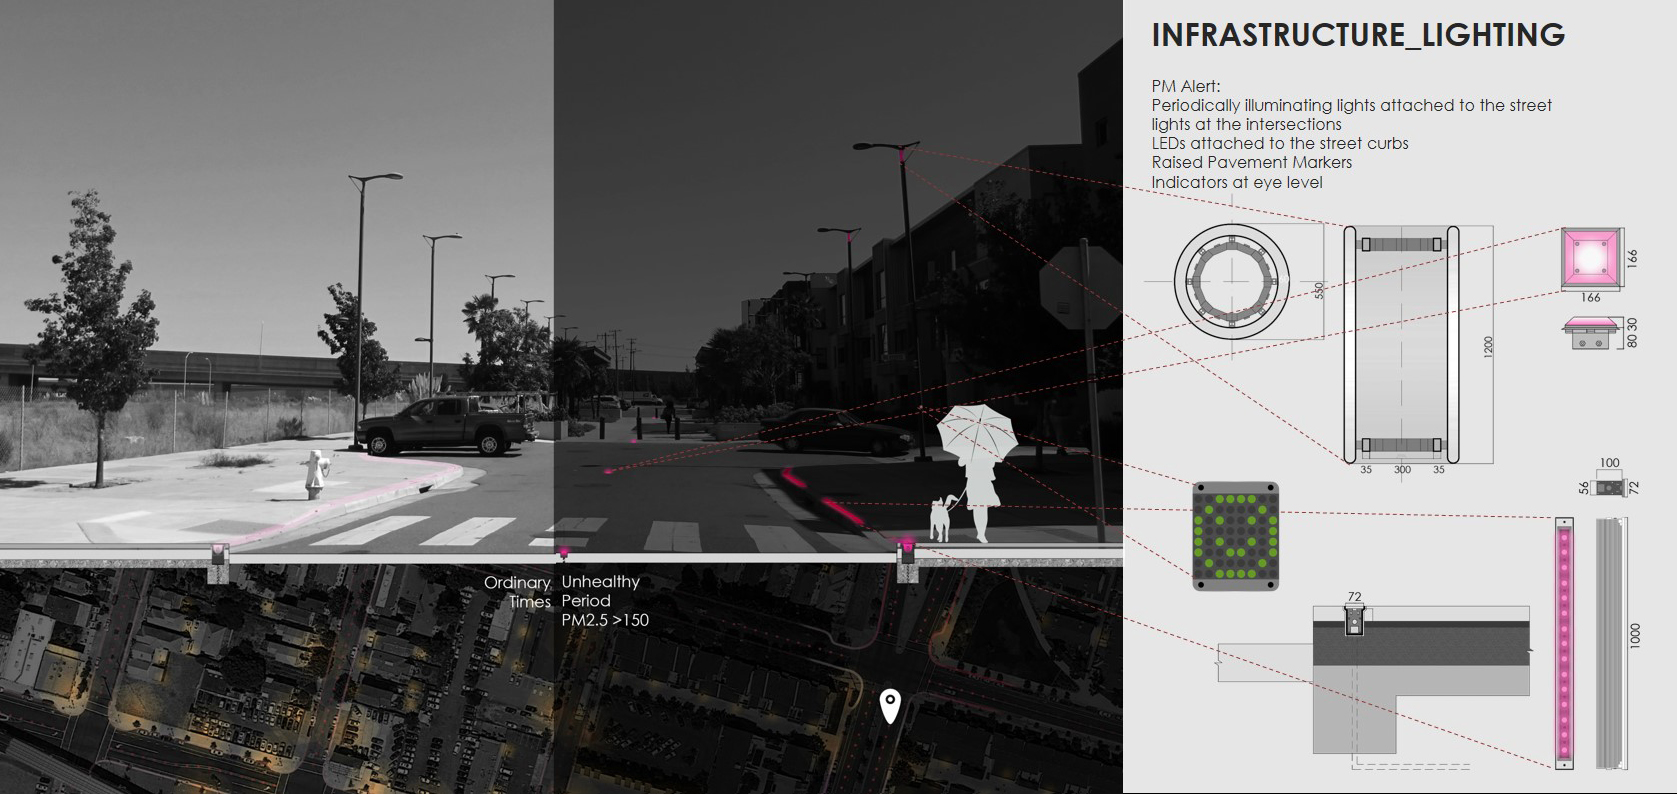 We have the opportunity to integrating sensing technology and light responsive systems into existing Oakland public infrastructure. Tube lights, attached to street lights at pedestrian intersections, can alert pedestrians of air quality at a distance. Ground lighting, embedded within street curbs, will connect to open spaces and intersections as well. The curbs themselves can indicate whether or not the current route is a healthy route, or, a harmful one. As air quality changes, the hue and brightness of the curb lighting change to reflect present air quality levels.
By incorporating sensing technology into the raised pavement markers on main streets and truck routs, we are able to educate drivers about PM levels. Small led face indicators at eye level will be continuously illuminated at residential intersections. During times of significant PM levels, this face indicates to viewers whether or not a face mask is recommended. Overall, our strategy takes advantage of existing infrastructure embedding data in a way that educates travelers about their environment, as they move through it.
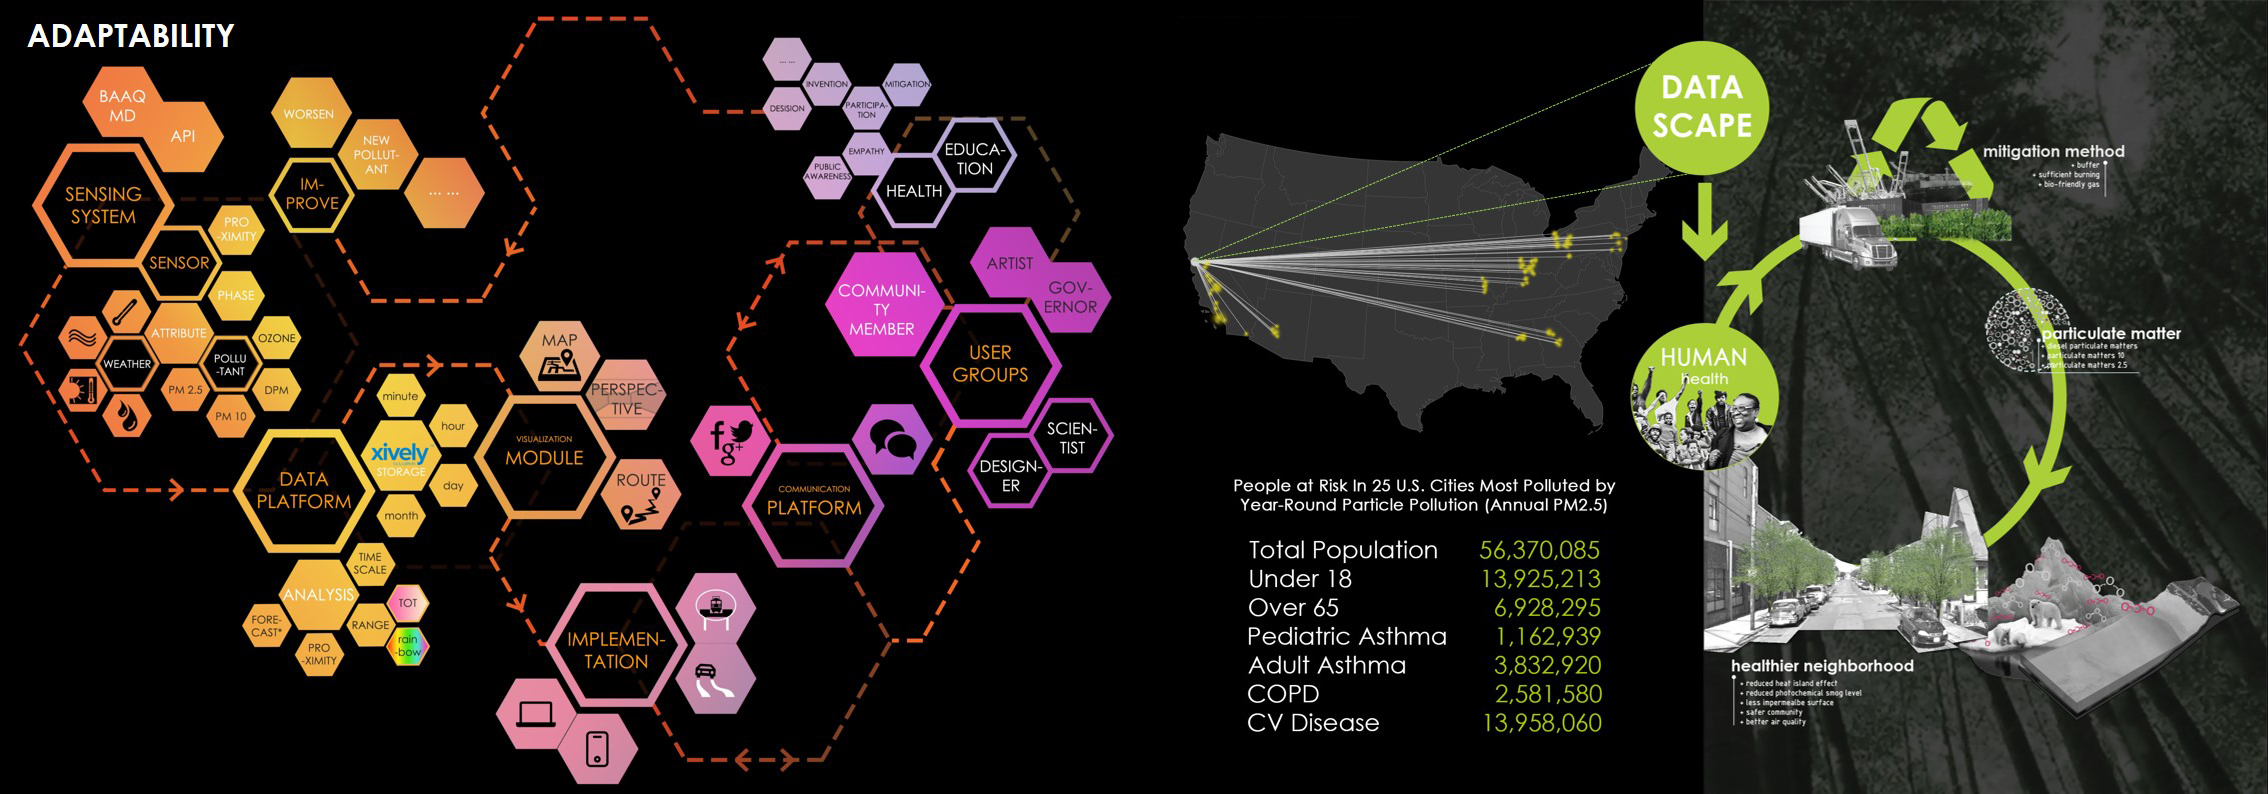
As new pollutants emerge and user needs changed, our framework will also evolve to encompass new environmental measurements. The immediate implication is that policy and mediation methods will be strengthened by illuminating invisible environmental conditions and democratizing the data which explains those conditions. As policy changes and overall quality of life is improved, the efficacy will be revealed, along with future sensing opportunities specific to place. Its poor air quality makes West Oakland the representative of this framework, which we hope can be deployed globally to other environmentally distressed communities.
References
- “Maritime Air Quality Improvement Plan.” Port of Oakland. Port of Oakland. Web. 7 Dec 2013. <http://www.portofoakland.com/pdf/environment/maqip090515.pdf>.
- “Bay Area Air Quality Management District PM2.5 Continuous.” Bay Area Air Quality Management District. Bay Area Air Quality Management District. Web. 7 Dec 2013.<http://gate1.baaqmd.gov/aqmet/aq.aspx>.
- “Oakland West Air Pollution: Real-time Air Quality Index (AQI).” aqicn.org. Web. 7 Dec 2013. <http://aqicn.org/?city=California/CoastandCentralBay/OaklandWest>.
- “Oakland Street Intersections.” Open Oakland. Open Oakland. Web. 7 Dec 2013. <http://data.openoakland.org/dataset/oakland-intersections>.
- “AIR QUALITY Community Empowerment through Knowledge and Action.” West Oakland Environmental Indicators Project. West Oakland Environmental Indicators Project. Web. 7 Dec 2013. <http://www.woeip.org/>.
- “Adapt Oakland An Ecosystem Economy.” Adapt Oakland. Adapt Oakland. Web. 7 Dec 2013. <http://adaptoakland.org/>.
- “SMART CITIZEN.” SMART CITIZEN. Fab Lab Barcelona. Web. 7 Dec 2013. <http://www.smartcitizen.me/>.
- “NetworkedCITY.” IAAC Smart City. Institute for Advanced Architecture of Catalonia. Web. 7 Dec 2013. <http://www.iaac.net/smart/?portfolio=networkedcity>.
- “Japan Geigermap.” Japan Geigermap. Safecast. Web. 7 Dec 2013. <http://japan.failedrobot.com/>.
- “NODE Sensory platforms that connect apps and smart devices to the real world.” VARIABLE. Variable, Inc.. Web. 7 Dec 2013. <http://variableinc.com/>.
- “Xively Cloud Services™.” Xively. LogMeIn, Inc.. Web. 7 Dec 2013. <https://xively.com/>.
You must log in to post a comment.